...
| Widget Connector | ||||||||||
|---|---|---|---|---|---|---|---|---|---|---|
|
| Table of Contents |
|---|
Locations
The Pivot table is available fro two locations.
...
NOTE: The Pivot table view can be converted into a gadget in a straightforward way by exporting it to a Dashboard.
User Interface & main steps
...
The pivot table is really user-friendly and intuitive, These are the main steps to work with:
...
The working area allows users to configure the content by drag&grop dimensions on the row and columns of the pivot table.
Drill down to issues (cells)
The Pivot table supports Count and Sum numeric and work time issue fields (aggregators)
The aggregator can be changed from the select box (8)
The result is displayed on each cell
Clicking on the aggregated result will open and list the issues of the cell on the Issue Navigator
...
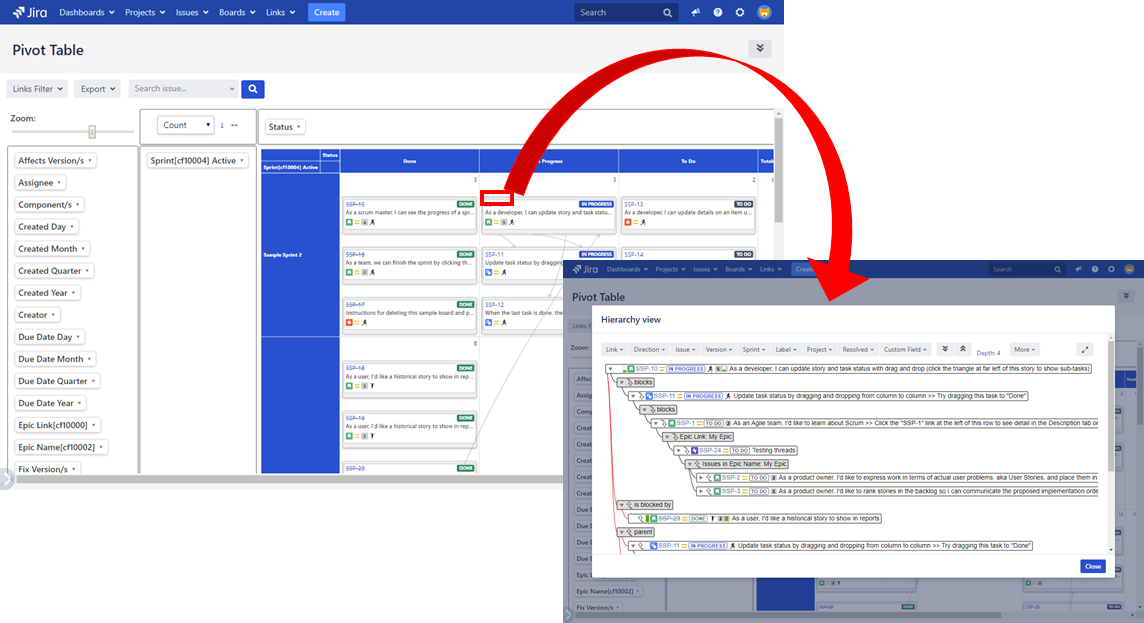
Hierarchical analysis
The pivot table supports massive analytics of JQL results and it displays the first level (depth =1) of links.
However, the users may want to perform deeper analysis on concrete issues: clicking on the issue key link will open the Tree view dialog for full issue traceability and impact.
Dealing with large and complex data
Highlighting
Frequently a large number of issues and links make the data difficult to read.
...
Alternatively, you can search for the issue from the select box (10):
...
Filtering links
The Links filter select (9) also allows showing and hiding links based on their type:
...
Hiding rows and columns
It is possible to hide concrete rows and columns by selecting the visible domain values from the select context menu of the dimensions:
...
Issue domain
By default, only the issues returned by the filter are taken into consideration. However, sometimes the users might also want to include all the linked issues into the resulting issue set.
...
The included issues not present in the initial filter result are displayed with a light blue bar.
Exporting (to Excel)
The Pivot table view can be exported to Excel for further analytics:
...